The first time I implemented autosuggest, it was a simple ordered list of suggestions based on prefix matching. Technically correct. You typed a few letters, everything that matched came back.
But people weren't finding what they were looking for. The right answers were there, just buried. Not at position eight or nine, sometimes much deeper. The matching was fine. Everything else was the problem.
I had to think about what better actually meant. Showing everything that matched wasn't enough. There were other factors in play, and the default order wasn't accounting for any of them.
This is how I worked through it. To keep it concrete, picture a recipe search. Someone starts typing the name of a dish and you suggest recipes as they go.
Matching comes first, and it is not ranking
Someone types "chick" and the first thing that happens is a filter. Every recipe whose name starts with those letters is a candidate. Everything else is not.
"chick" → "chicken soup"    ✓ candidate
"chick" → "chickpea stew"   ✓ candidate
"chick" → "banana bread"    ✗ not a candidate
That is a string comparison, and it is the job of your search index. You do not walk a million recipes checking each one. The index is built so that a prefix jumps you straight to the few hundred that start with those letters.
This matters for everything that follows. Banana bread is not ranked last on a search for "chick." It is not ranked at all. It never enters the conversation. So nothing in the rest of this article needs to defend against a non-match winning, because a non-match is never scored in the first place.
The filter hands you a few hundred candidates. Now you have the actual problem.
Everything that survives ties
You have room for ten. The filter gave you hundreds, and as far as it is concerned they are all identical, because they all passed the same test.
There is nothing to sort by. So you fall back to the only property you have, which is the name itself, and sort A to Z.
| # | Recipe |
|---|---|
| 1 | chicken aspic |
| 2 | chicken curry |
| 3 | chicken parmesan |
| 4 | chicken pot pie |
| 5 | chicken soup |
| 6 | chickpea stew |
Alphabetical order is not wrong. It is just completely unrelated to what anybody wants for dinner. You are sorting by a property of the string instead of a property of the recipe.
What you need is a number that says how relevant each candidate is, so you can sort by that instead. Call it the relevance score. Everything from here is working out what goes into it.
Add count
The strongest thing you know about a recipe is how many people wanted it. Some get saved constantly. Others sit untouched. That is a number, and unlike the match test, it varies.
It assumes you have it. Every recipe carries a count, and something increments it when a person picks that recipe. Whatever you are ranking, there is usually some version of this already sitting in the data: clicks on a result, plays on a track, views on a page.
relevance = count
| # | Recipe | Count |
|---|---|---|
| 1 | chicken curry | 84,000 |
| 2 | chicken soup | 52,000 |
| 3 | chicken parmesan | 31,000 |
| 4 | chicken pot pie | 18,000 |
| 5 | chickpea stew | 9,500 |
| 6 | chicken aspic | 12 |
Look at what was sitting at the top of the alphabetical list. Chicken aspic. Twelve people in the history of the internet have made chicken aspic, and it was the first thing the person saw, because the letter a comes before c. It is now last, where it belongs.
One thing worth knowing before you trust the count too much. It is not a measure of quality, it is a measure of what got seen and clicked. Recipes that rank well get picked more, which raises their count, which makes them rank better. Your strongest signal is partly a record of what your own ranking has already been showing people.
Log the count
Sorting by count works. The problem is what it does to every signal you add after it.
Chicken curry has a count of 84,000. Chickpea stew has 9,500. That is not a small difference, it is nine times. And it is the kind of difference you see constantly in real data, where a few things are wildly popular and everything else is not.
Now suppose you want to add a second signal. Something that knows this person eats vegetarian, so chickpea stew should climb. That signal has to be strong enough to overcome a nine to one popularity difference, or the top of the list never changes.
You cannot make it that strong. If a single preference outweighs nine times the popularity, then popularity has stopped mattering at all, and you have traded one broken ranking for another.
So with raw counts you are stuck. Popularity is so dominant that every other signal you build is decoration. It can nudge things a little, but it can never actually change the answer.
Taking the log fixes this, and it is worth being precise about what it fixes, because it is not what people usually assume.
relevance = log(count)
| Recipe | log(count) | Result |
|---|---|---|
| chicken curry | log(84,000) | 4.924 |
| chicken soup | log(52,000) | 4.716 |
| chicken parmesan | log(31,000) | 4.491 |
| chicken pot pie | log(18,000) | 4.255 |
| chickpea stew | log(9,500) | 3.978 |
| chicken aspic | log(12) | 1.079 |
Chicken curry had nine times the count of chickpea stew. After the log it has about 1.2 times the score. The counts still run in the same direction, they are just no longer nine times apart.
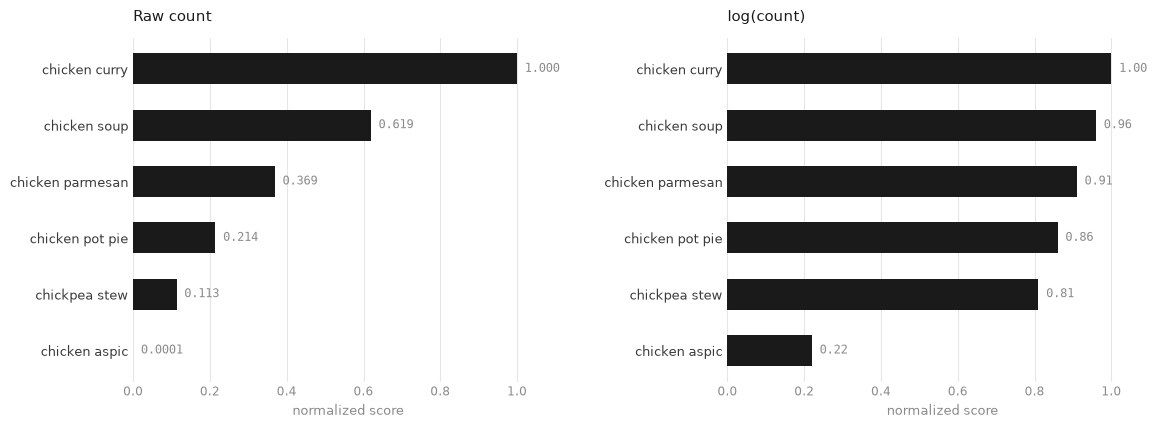
Notice what did not change. The order. Curry is still first, aspic is still last. A bigger count always produces a bigger log, so taking a log cannot reorder anything by itself. If you thought the log was going to fix the ranking, it does not, and it never could.
What it changed is how far apart everything is. A vegetarian preference cannot overcome nine times the popularity. It can absolutely overcome 1.2 times.
The log does not rank anything. It makes it possible for everything else to.
Two pieces of housekeeping before moving on. A recipe nobody has picked has a count of zero, and there is no log of zero, so treat it as a count of one. log(1) is 0, meaning a brand new recipe contributes nothing from popularity, and it can still earn points from every other term, which is exactly what a brand new recipe should do. And everything you are about to add will be a small number between 0 and 1, so the count needs to be on that scale too. Divide each log by the largest log in the set, which is 4.924.
| Recipe | log(count) / 4.924 | Score |
|---|---|---|
| chicken curry | 4.924 / 4.924 | 1.00 |
| chicken soup | 4.716 / 4.924 | 0.96 |
| chicken parmesan | 4.491 / 4.924 | 0.91 |
| chicken pot pie | 4.255 / 4.924 | 0.86 |
| chickpea stew | 3.978 / 4.924 | 0.81 |
| chicken aspic | 1.079 / 4.924 | 0.22 |
That is the number that goes in the formula.
Not every match is equally good
The filter is binary, so it cannot tell a good match from a lazy one. Type "chicken" and all three of these are equally valid candidates:
chicken soup
chicken parmesan
chicken curry with roasted butternut squash
They are obviously not equally good. The person typed seven characters. For the first name that accounts for most of it. For the last it accounts for almost none of it. A short name that the query nearly fills is a confident match. A long name where the query is a small prefix is a guess about where the person was heading.
You can measure that directly. Divide the length of what they typed by the length of the name, and you get how much of the name the query actually covers.
coverage = length of query / length of name
| Recipe | Query / name length | Coverage |
|---|---|---|
| chicken soup | 7 / 12 | 0.58 |
| chicken parmesan | 7 / 16 | 0.44 |
| chicken curry with roasted butternut squash | 7 / 43 | 0.16 |
Now the obvious question. If coverage measures match quality, why not filter on it instead of the prefix test?
Because it never returns zero. A recipe that matched always has some coverage, so there is no clean line to cut at, and there should not be one. A weak match is still a match. Someone typing "chick" who wants the long curry recipe should still be able to find it, just not at the top.
So the filter stays binary and coverage joins the relevance score as another term.
relevance = log(count) + coverage
Every other signal is the same move
Once the shape is there, adding a new signal is always the same move. Another term in the sum, lifting recipes that have some property you care about. Coverage was free, because it comes from the name. Everything below needs a field you have to build and keep accurate, which is where most of the real work turns out to live.
Recency rewards recipes people are saving right now. The thing to track is one date per recipe: the last time someone saved it. Every save overwrites it with today, so nothing has to decide what counts as popular, it is just the most recent save. This is not the date the recipe was published. An old recipe can pick up a fresh wave of saves, like a soup in a cold snap, and a brand new one might sit unsaved for months. Recency is about recently wanted, not recently created.
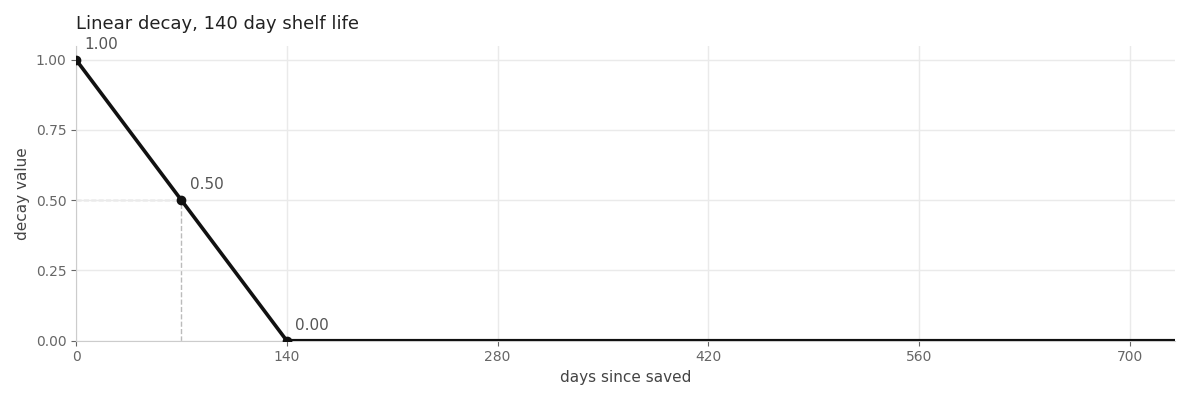
From there you want a number that is high right after a recipe is saved and fades as the days pass. Call it the decay factor. First pick a shelf life, how many days a recipe stays fresh before it counts for nothing, say 140. Then shrink the score evenly across it.
decay = 1 − (days since saved / shelf life)
Both sides are plain: days since saved is how long ago the last save was, shelf life is how long you have decided a recipe stays fresh. Take a 140 day shelf life. A recipe saved today scores 1. At 70 days it is halfway down at 0.50. At 140 days it hits 0, and anything older stays at 0 rather than going negative. One number to pick, the shelf life, and the rest is subtraction. Decide how fast your domain moves and the shelf life follows. News is spent in a day. Recipes stay fresh for a season.
| Last saved | Decay factor |
|---|---|
| today | 1.00 |
| 35 days ago | 0.75 |
| 70 days ago | 0.50 |
| 140 days ago | 0.00 |
Bigger systems often swap the straight line for a curve that drops fast at first and then flattens, which fits how attention fades and lets an old favorite keep a sliver of credit. Same idea, a curve instead of a line, and nothing else changes.
Context rewards recipes that fit the situation. It assumes the recipes are tagged, and someone has to decide that chicken soup is a winter dish and shakshuka is breakfast. Editors, the author, or a model reading the ingredients. That is a whole problem of its own.
Once the tags exist, the signal is simple. Each condition you can check is worth a fixed amount, and they stack. Cap the stack at 1, so context stays on the same 0 to 1 scale as every other signal, and its weight in the formula decides what that is worth against popularity.
| Condition | Boost |
|---|---|
| Tagged breakfast, and it is morning | +0.5 |
| Tagged winter, and it is December | +0.5 |
| Tagged vegetarian, and they have been browsing vegetarian | +0.5 |
A chickpea stew in December, for someone browsing vegetarian, picks up 1.0 from context. A chicken curry in the same situation picks up nothing. Nothing about the curry got worse, the stew just fits the moment better.
Personalization is the same shape, but the condition is about this specific person rather than the situation. They cook a lot of Thai food, they reach for chickpeas, they have made this recipe before. It assumes a per-user history, which is a bigger commitment than anything above it: accounts, a store that grows with every user, and a privacy posture you can defend.
It also has a cold start. A new person has no history, so the term is zero for them. Nothing breaks, because it is one term among several. They just get the unpersonalized ranking, which is the ranking you spent the rest of the article building.
relevance = w1·log(count) + w2·coverage + w3·recency + w4·context + w5·personalization
The w's are weights, one per signal, saying how much each term counts. Every term does the same job. It nudges a recipe up for a reason you can name. That is the whole formula.
The numbers are precomputed
Looking at that formula, it is easy to picture the server doing a pile of math on every keystroke. It does not. The count, the last-saved date, and the tags are all written onto each recipe ahead of time by a background job. By the time someone starts typing, every number the formula needs is already sitting on the record.
At query time you are reading stored values and doing a little arithmetic on a few hundred candidates, which is why autosuggest can feel instant. Recency is the one exception, because it depends on what today is and has to be computed live, but decay from a stored timestamp is a subtraction, cheap enough that it does not matter.
The expensive work happens before anyone types. The keystroke just reads the answer.
Weights are tuned, not calculated
There is no formula for the weights. You do not derive them, you guess and correct. But you do not have to guess blindly, because the signals have an obvious pecking order. Popularity is the most reliable thing you know about a recipe, so it gets the largest weight. Everything else adjusts around it.
The weights do not need to add up to 1. Multiply all of them by the same number and not a single position changes, because only their ratios matter. So anchor popularity at 1.0 and read every other weight as a fraction of it. Context at 0.4 means context is worth forty percent of popularity.
| Signal | Weight | Why |
|---|---|---|
| log(count) | 1.0 | Popularity is your most reliable signal. Anchor everything to it. |
| context | 0.4 | Strong enough to reshuffle the top few, not strong enough to bury a favorite. |
| personalization | 0.4 | Same reasoning as context, once you have the history to support it. |
| recency | 0.3 | A recent surge matters, but a classic should not fall off because it peaked last year. |
| coverage | 0.2 | Only there to break ties. If it is deciding anything on its own, it is too high. |
Now watch what those weights do. Same query, "chick". It is December, and this person has been browsing vegetarian recipes all week. Personalization sits this one out: browsing this session is context, and this person has no saved history, so the personalization term is zero for every recipe. That is the cold start from the last section. Every column adds one more signal to the one before it. The first column sets the order. After that, each cell just shows the score, an arrow marks where a rank changed, and first place is always labeled.
| Recipe | count | + coverage | + recency | + context |
|---|---|---|---|---|
| chicken curry | 1st 1.00 | 1st 1.08 | 1st 1.37 | ↓ 3rd 1.37 |
| chicken soup | 2nd 0.96 | 1.04 | 1.28 | 1.48 |
| chicken parmesan | 3rd 0.91 | 0.97 | ↓ 4th 1.14 | ↓ 5th 1.14 |
| chicken pot pie | 4th 0.86 | 0.93 | ↓ 5th 1.04 | ↑ 4th 1.24 |
| chickpea stew | 5th 0.81 | 0.88 | ↑ 3rd 1.17 | ↑ 1st 1.57 |
| chicken aspic | 6th 0.22 | 0.30 | 0.30 | 0.30 |
Follow chickpea stew across the row. Fifth, fifth, third, first.
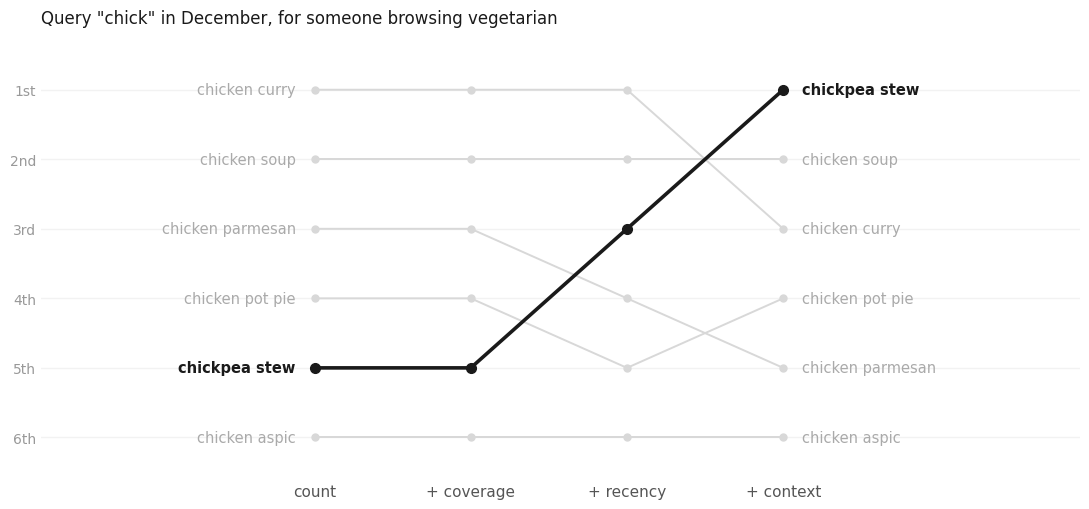
Popularity alone leaves it in fifth. Coverage does not move it at all, which is exactly what a tie-breaker should do. Recency lifts it to third, because it was saved recently. Context puts it on top, because it is December and this person eats vegetarian, and those two conditions together are worth more than the nine times higher count that chicken curry has.
Chicken curry did not get worse. Its score never dropped, not once, in any column. It went from first to third because two other recipes fit this person and this moment better than it did.
One last run, to show the log is what made that climb possible. Same signals, same weights, same person, run twice: once with the popularity term as raw counts divided by the biggest count, once with the log. Here is where everyone finishes in each world.
| Recipe | Raw counts | With the log |
|---|---|---|
| chicken curry | 1st 1.37 | 3rd 1.37 |
| chicken soup | 2nd 1.14 | 2nd 1.48 |
| chicken parmesan | 4th 0.60 | 5th 1.14 |
| chicken pot pie | 5th 0.59 | 4th 1.24 |
| chickpea stew | 3rd 0.87 | 1st 1.57 |
| chicken aspic | 6th 0.08 | 6th 0.30 |
Chickpea stew collects every boost it collected before and stalls in third. Curry scores 1.37 in both worlds, but on raw counts nothing can reach it, because the nine to one popularity gap costs stew nine tenths of a point before the other signals even speak. The middle of the list wiggles. The top does not move. That is what stuck means, and the log is the only difference between this table and the one above it.
Nudge these numbers, run searches you know the right answers to, and look hard at what comes back wrong. A bad result almost always points at a weight that is too high or too low. Later, once you have data on what people actually cooked, you can learn the weights from behavior instead of intuition.
When it is done
The formula is never really finished, and new terms come from more than one place. Sometimes a result is visibly wrong and nothing already in the formula explains why. Sometimes it is a product call, like deciding seasonal dishes should surface in season. Sometimes new data shows up, ratings, delivery times, repeat cooks, and you ask whether it earns a term. The test is the same for all of them: add the term, rerun searches you know the right answers to, and keep it only if the results get better.
Nobody designs a ranker like this up front. You start with a filter and no ranking at all, look at what it gets wrong, and let each specific failure pull the next term out of you. Count came from every candidate tying. The log came from the popularity gap being too wide for any other signal to cross. Coverage came from the filter treating a barely relevant name as well as a perfect one. Every piece is there because the version before it broke in a way you could see.
The signals change with the data. A music app would rank by plays and release date. A map would rank by distance and rating. The shape does not change. The filter decides who is a candidate, the relevance score decides the order, and you earn each new term by watching the results tell you it is missing.